Facebook was kind enough to open source the XHProf extension last year, but it flew under my radar until I saw a presentation including it earlier this year when they showed off HipHop. XHProf provides profiling information about your application, while being lightweight enough to run on a production server (against a percentage of requests). Once we got it installed we ran into a few limitations with the existing GUI. With the help of Graham Slater (one of our front end designers) I hacked on the Facebook code to come up with our own flavor. Let me stress the word “hack." I was given some really tough deadlines for this project so functionality was literally hacked into the existing codebase.
Key Features:
- Nice interface
- MySQL backend for data storage
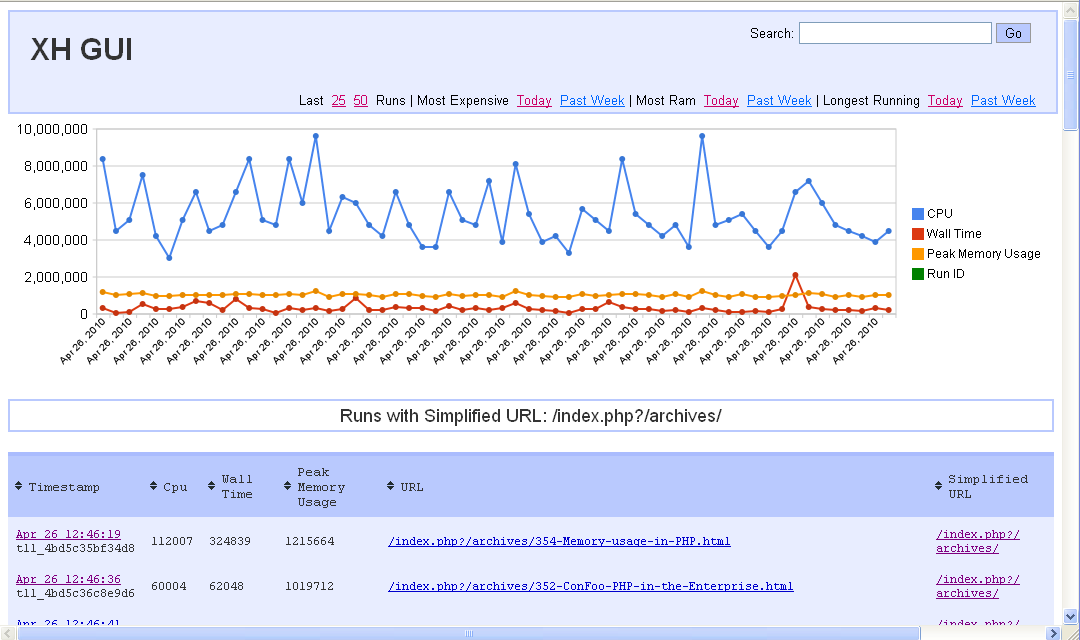
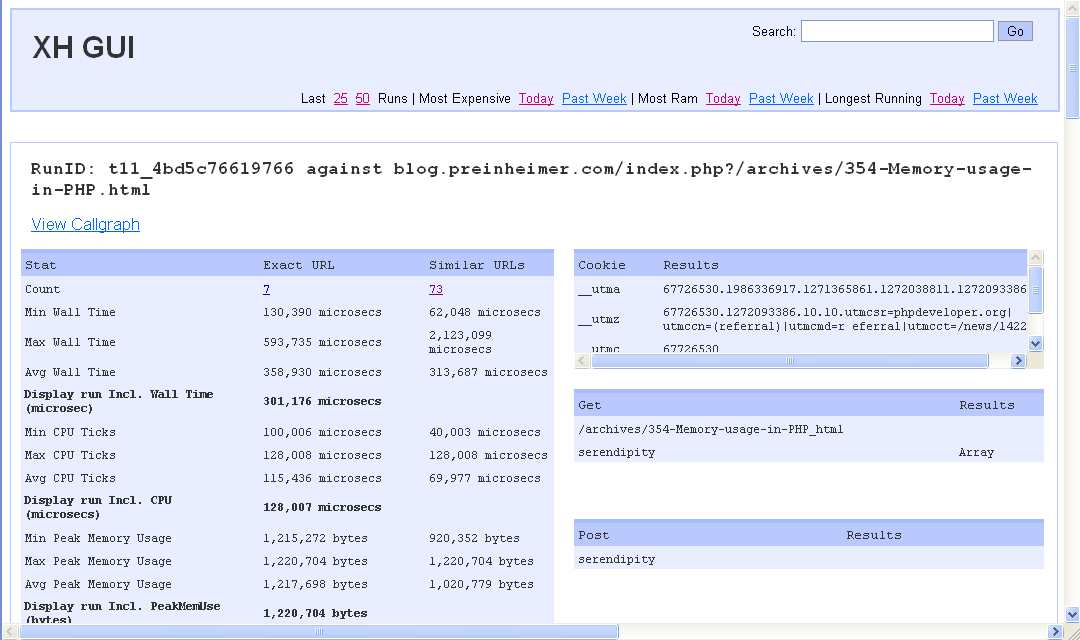
- Stores key values such as Peak Memory Usage, Wall Time, and CPU Ticks in the database directly for easy lookup.
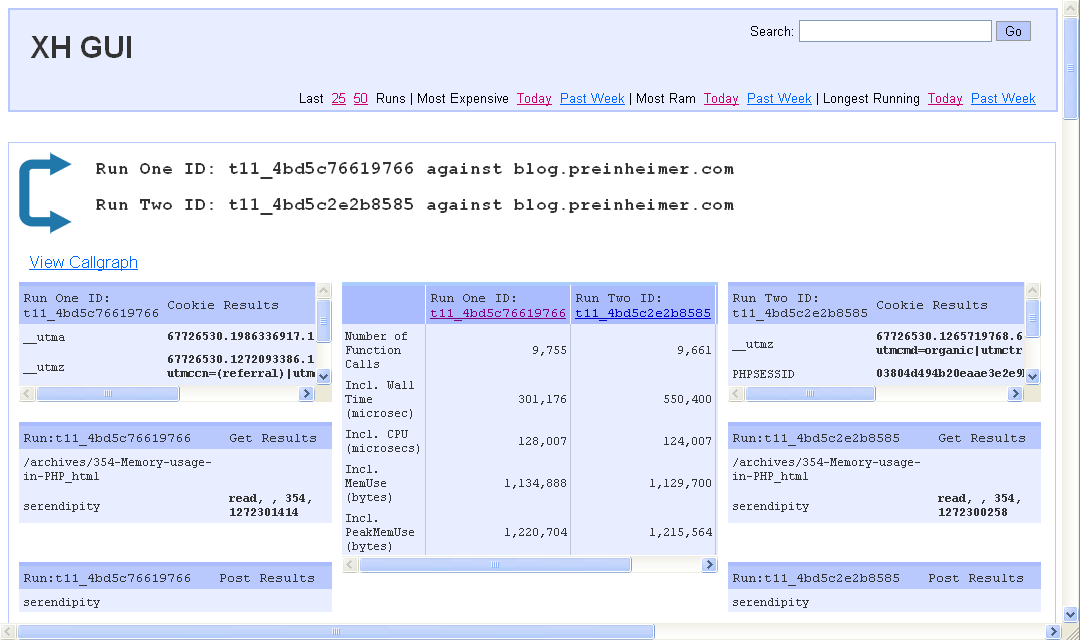
- Stores Get, Post, and Cookie data for easy comparison (so you can determine why a run hit that execution path)
- Display includes easy lookup for worst runs, most recent, etc.
- Support for profiling a percentage of requests, or on demand
- Support for not including a link to profile requests on certain files (like xml documents, images, etc).
- Uses Google Data Visualization API to graph runs over time
- Concept of “Similar” urls, to handle ?story=23 and ?story=24 having different URLs, but similar to identical code execution paths
Screenshots:

Download:
Please download the source code from GitHub
Warnings:
Seriously, we hacked this up! Please let me know if you encounter any bugs, there's probably a bunch.
Comments »
I landed on http://webadvent.org/2010/profiling-with-xhgui-by-paul-reinheimer, from where i decided to use XHGui and installed it from https://github.com/preinheimer/xhprof, which uses mongodb
I installed mongodb too and able to get the profiles but realized, it only lists the most CPU, Recent etc., does not allow drilling down inside the methods, thought will validate if that is it or if i am missing something
coz if that is all, then i think the original xhprof is more useful (yes though it does runs only run by run though and so user friendly like yours)
Was wondering, what i should do to get these
http://blog.preinheimer.com/uploads/runpage.png
http://blog.preinheimer.com/uploads/urlpage.png
Can you please correct me if i am missing something?
also was unable to do find fies and folder you are referring to in your blog "http://webadvent.org/2010/profiling-with-xhgui-by-paul-reinheimer", such as
"The UI directories contain a config file (in /xhprof_lib). You’ll need to copy config.sample.php to config.php and make the appropriate changes. There are a bunch of settings to be aware of:"
Where is xhprof_lib ?
To make things nice and confusing, there's currently two GUIs. There's the one built on MongoDB which is still in beta really, and the one mentioned in that Advent post which runs on more traditional databases like MySQL or SQL Server.
This version has the features you're referencing: https://github.com/preinheimer/xhgui
Tracked: May 13, 11:41