Facebook was kind enough to open source the XHProf extension last year, but it flew under my radar until I saw a presentation including it earlier this year when they showed off HipHop. XHProf provides profiling information about your application, while being lightweight enough to run on a production server (against a percentage of requests). Once we got it installed we ran into a few limitations with the existing GUI. With the help of Graham Slater (one of our front end designers) I hacked on the Facebook code to come up with our own flavor. Let me stress the word “hack." I was given some really tough deadlines for this project so functionality was literally hacked into the existing codebase.
Key Features:
- Nice interface
- MySQL backend for data storage
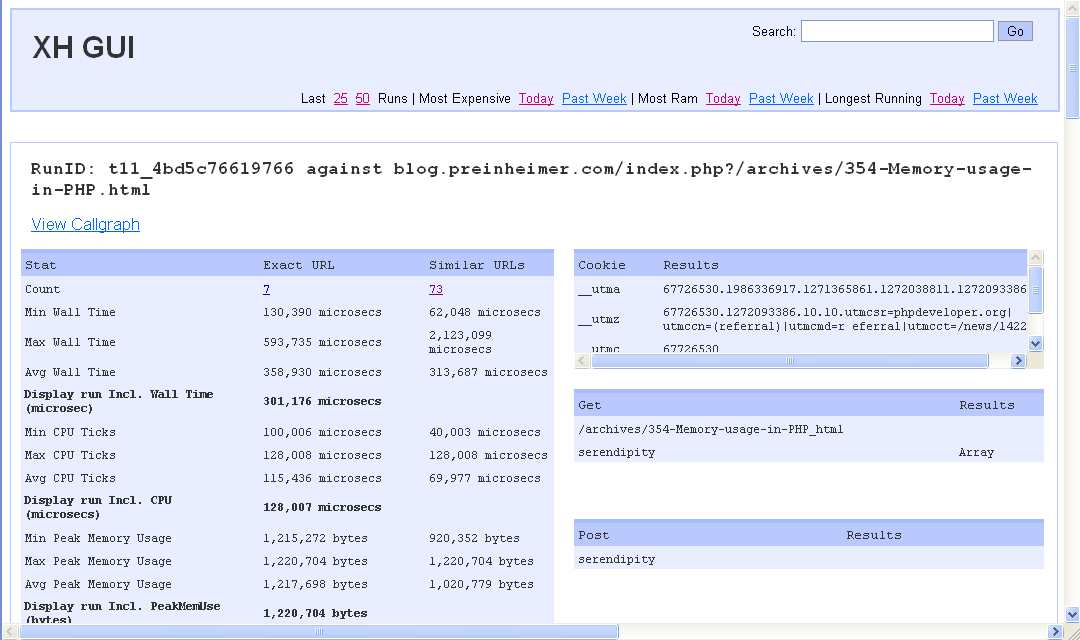
- Stores key values such as Peak Memory Usage, Wall Time, and CPU Ticks in the database directly for easy lookup.
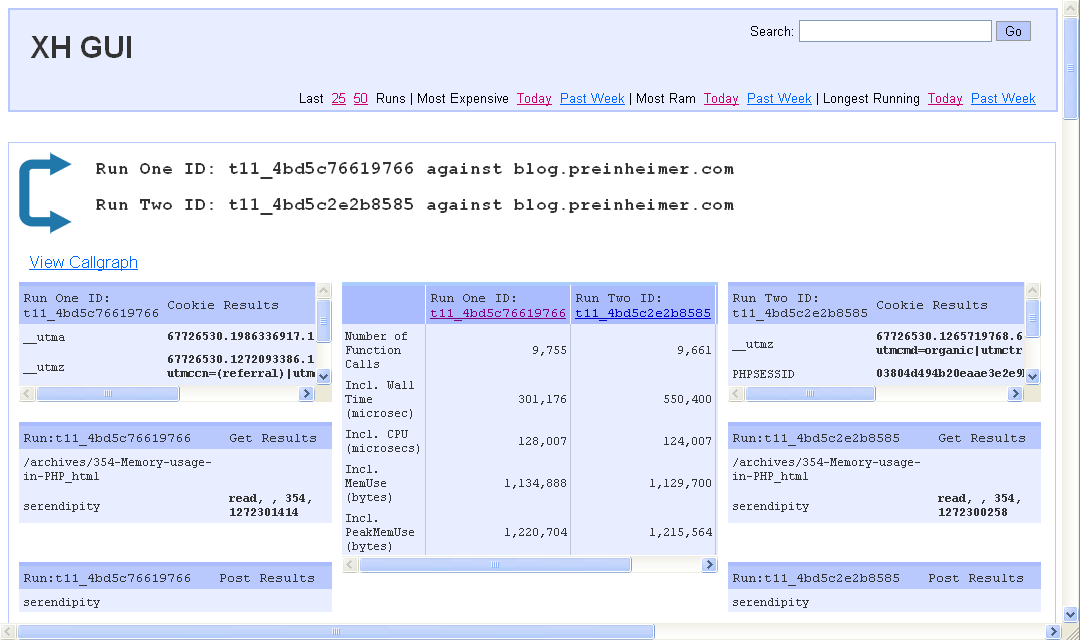
- Stores Get, Post, and Cookie data for easy comparison (so you can determine why a run hit that execution path)
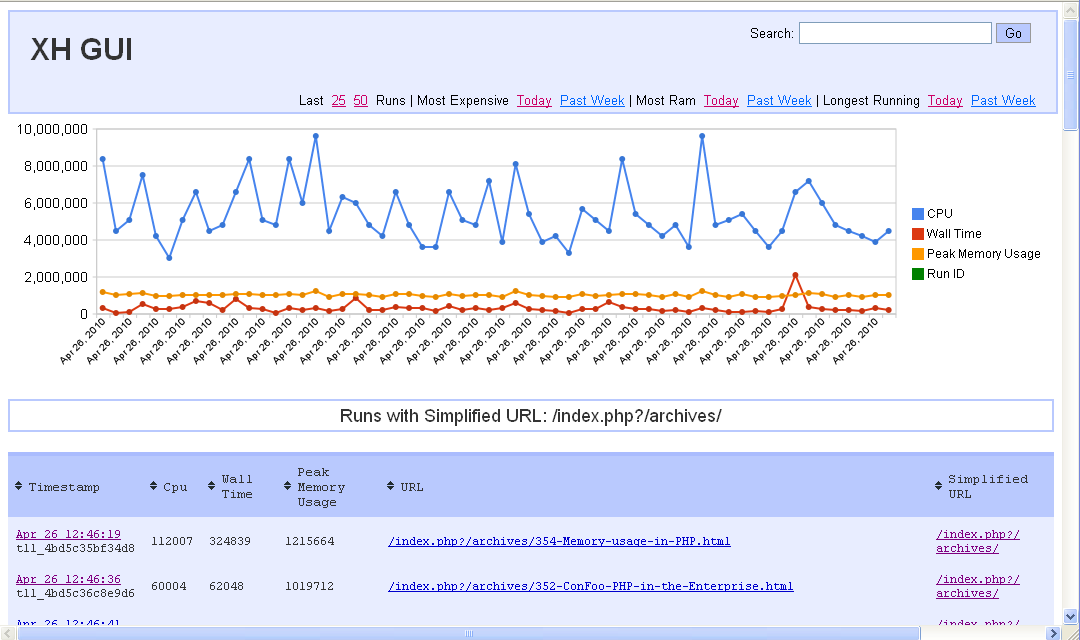
- Display includes easy lookup for worst runs, most recent, etc.
- Support for profiling a percentage of requests, or on demand
- Support for not including a link to profile requests on certain files (like xml documents, images, etc).
- Uses Google Data Visualization API to graph runs over time
- Concept of “Similar” urls, to handle ?story=23 and ?story=24 having different URLs, but similar to identical code execution paths
Screenshots:

Download:
Please download the source code from GitHub
Warnings:
Seriously, we hacked this up! Please let me know if you encounter any bugs, there's probably a bunch.