I merged my Highcharts branch into master today, including a bunch of improvements to the GUI for XHProf including:
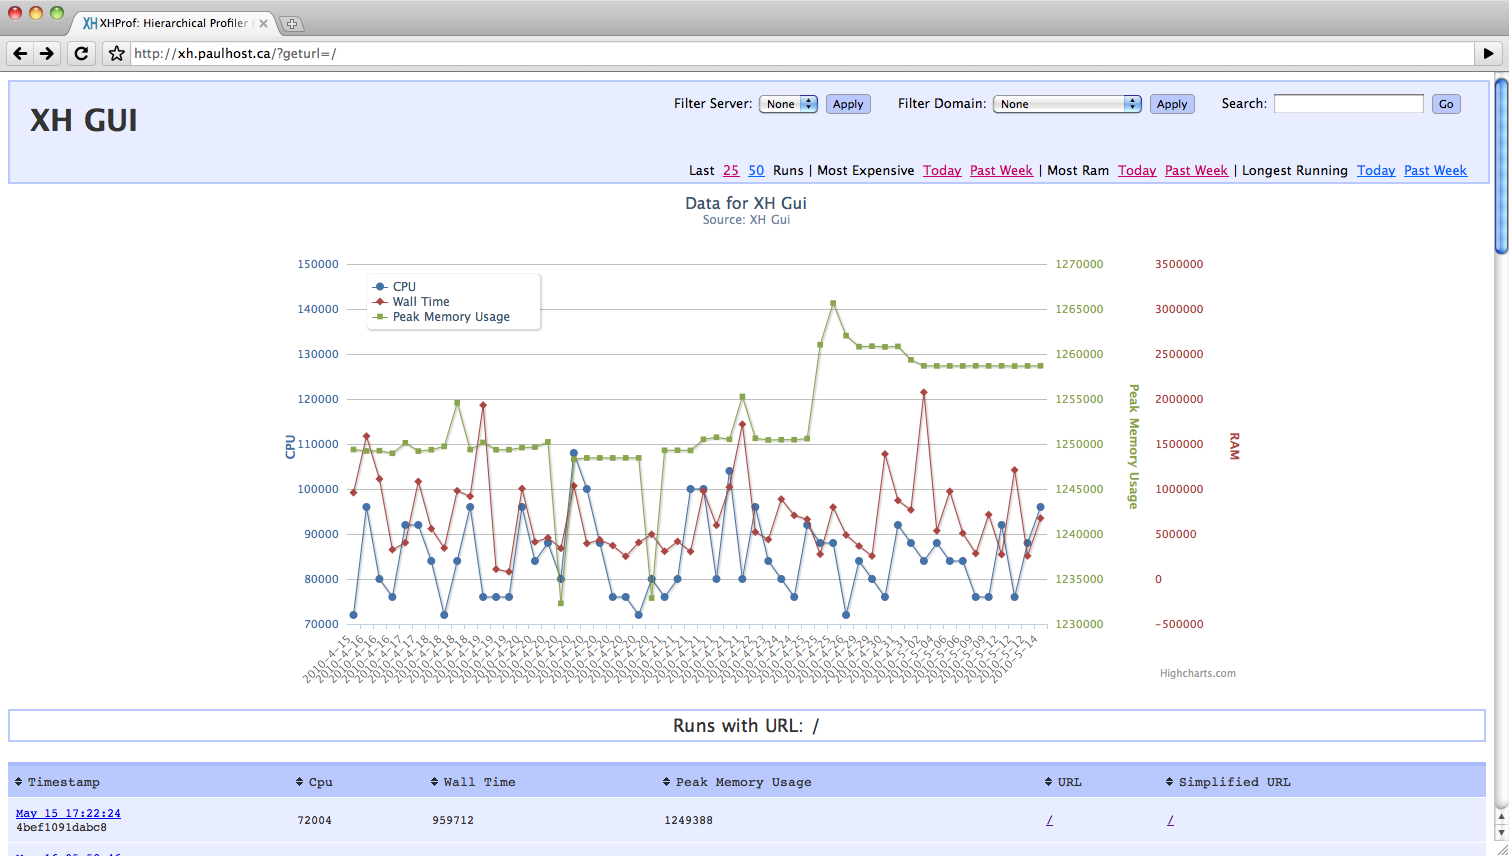
- Using Highcharts for graphing URLs over time, which allows for multiple axis per graph
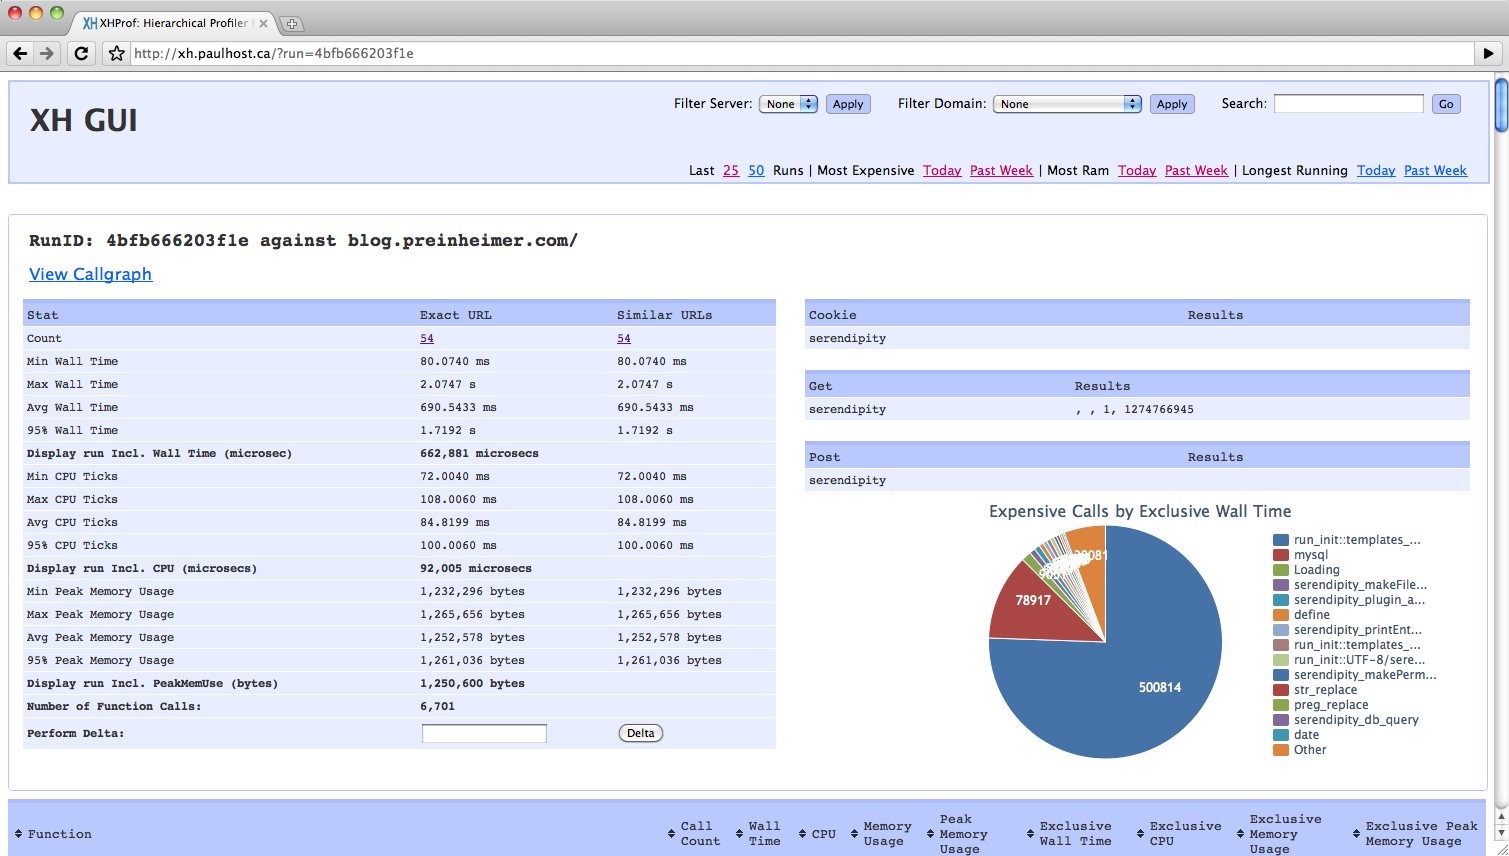
- Adding a pie chart to the individual run page to show where time was spent on page load
- Ability to merge various calls for display within the pie chart (e.g. mysql_* into mysql)
- Switched to the javascript tablesorter for the single run results
- Filter to allow you to view results only from a specific server or domain
Highcharts is a commercial library in Javascript for graphing, it's really easy to use and offers more features than the Google libraries used previously. I've purchased a license for the application so that anyone using this gui, regardless of the type of application they're profiling, can do so. The Highcharts integration was done by my colleague Graham Slater.
I really didn't consider the branch "done", the diff page still needs the pie charts, and to be switched over to the new table format. However, the license file received some serious updates to accurately represent the state of the code base and I considered making that file accurate to be a high priority.
Screenshots
As always, the code is available at GitHub